- Lykeion
- Posts
- Charts of the Month - January '24
Charts of the Month - January '24
Uranium, Manufacturing Spend, Maturity Walls, The China to India Pivot, and Indonesia Rising
Tim Purcell
February 01, 2024

Uranium
If you haven’t had a chance to read last week’s Uranium Primer (“Uranium is Having a Moment”), here’s your reminder to do so.
There are few issues in the world today that are widely agreed upon, especially between nation states, but very recently, and surprising to most (myself included), increasing nuclear power capacity has become one of those rare few things.
From Asia to the West, through India, the Middle East, and Europe, the vast majority of global governments are ramping up plans to increase nuclear-powered electricity, and in the case of the 22 members of the COP28 agreement, triple their capacity by 2050.
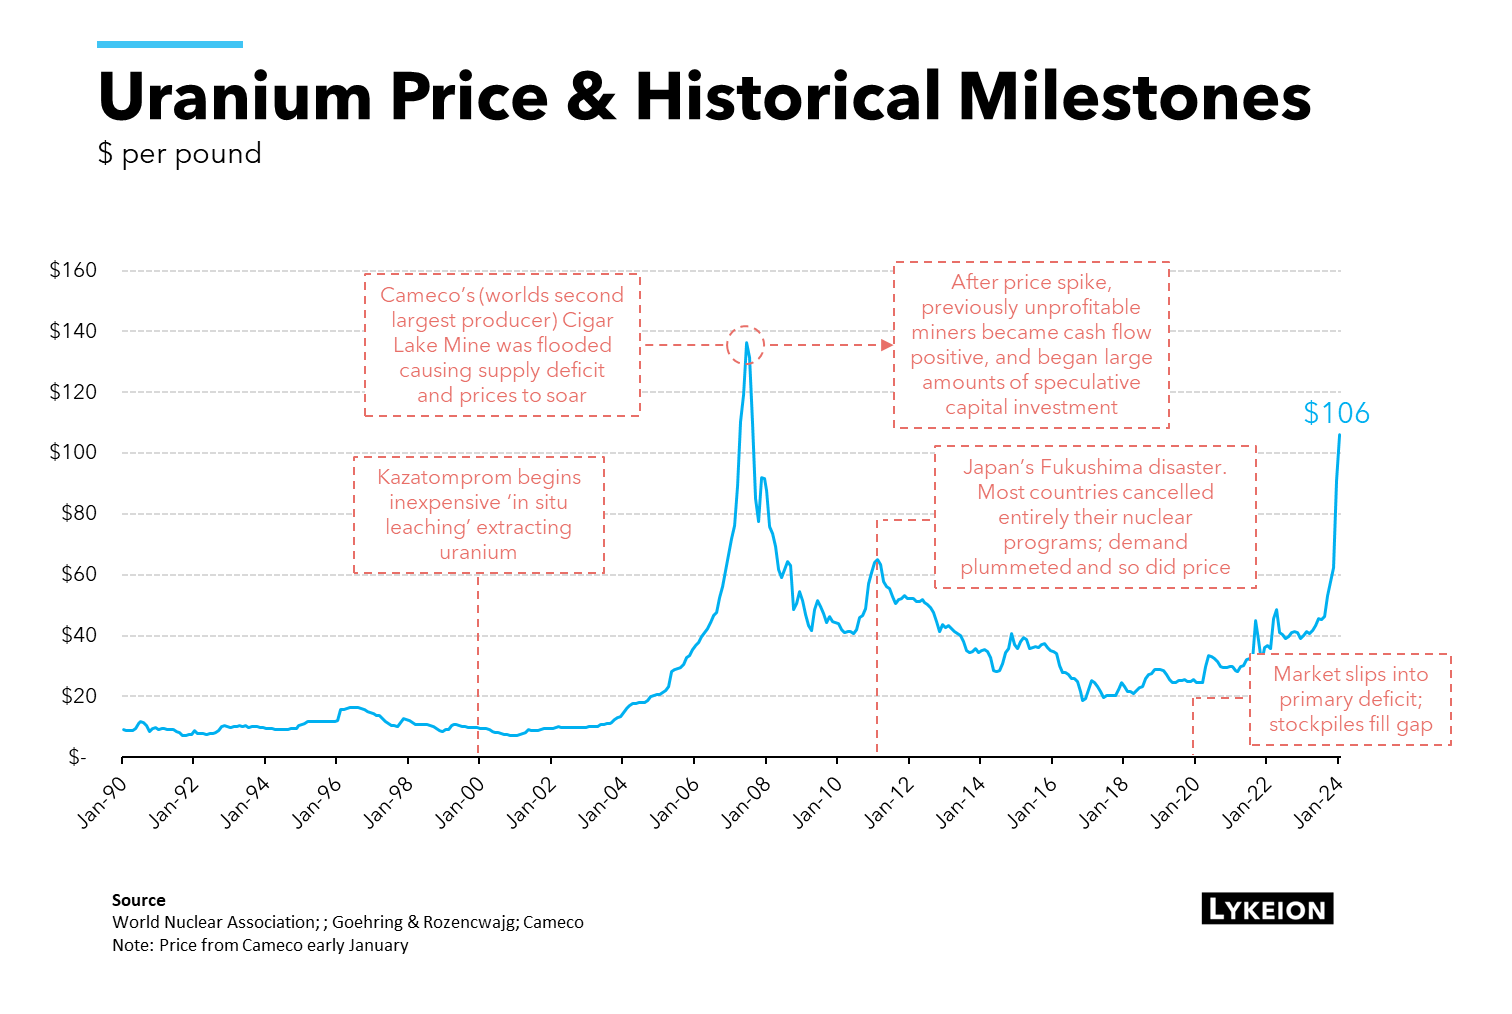
This push, including China’s 55 current reactors, 22 under construction and 70 more in their planning phases, is already running up against real physical constraints in the uranium fuel market. New supply has been nonexistent over the last decade after the Fukushima accident, and the current mining supply is not only not enough to keep up with current demand, but stockpiles of uranium have mostly been depleted. To add insult to injury, just last week the world's largest uranium miner, Kazakhstan’s Kazatomprom, announced that production targets will not be met due to construction delays and “challenges related to the availability of sulfuric acid” [a key ingredient for a mining technique called in-situ leaching].
Now, “the fuel that powers the 440 active nuclear reactors across 32 countries today (~10% of the world's electricity and 25% of the world's low-carbon energy) has gone parabolic and is now up 120% over the last year.”
Head over to the Uranium Primer to get a deeper look at this commodity that sits at the center of global economics, energy, geopolitics, and environmentalism.
Manufacturing Spend
Another underappreciated chart that’s going up and to the right, is construction spending on manufacturing capacity in the US.
It’s no secret that Western nations are becoming increasingly more vocal about deleveraging themselves from China for critical supply chains and manufacturing capacity for goods deemed necessary to national security.
And now it appears that spending on the infrastructure that’s required to accomplish this deleveraging is well on its way.
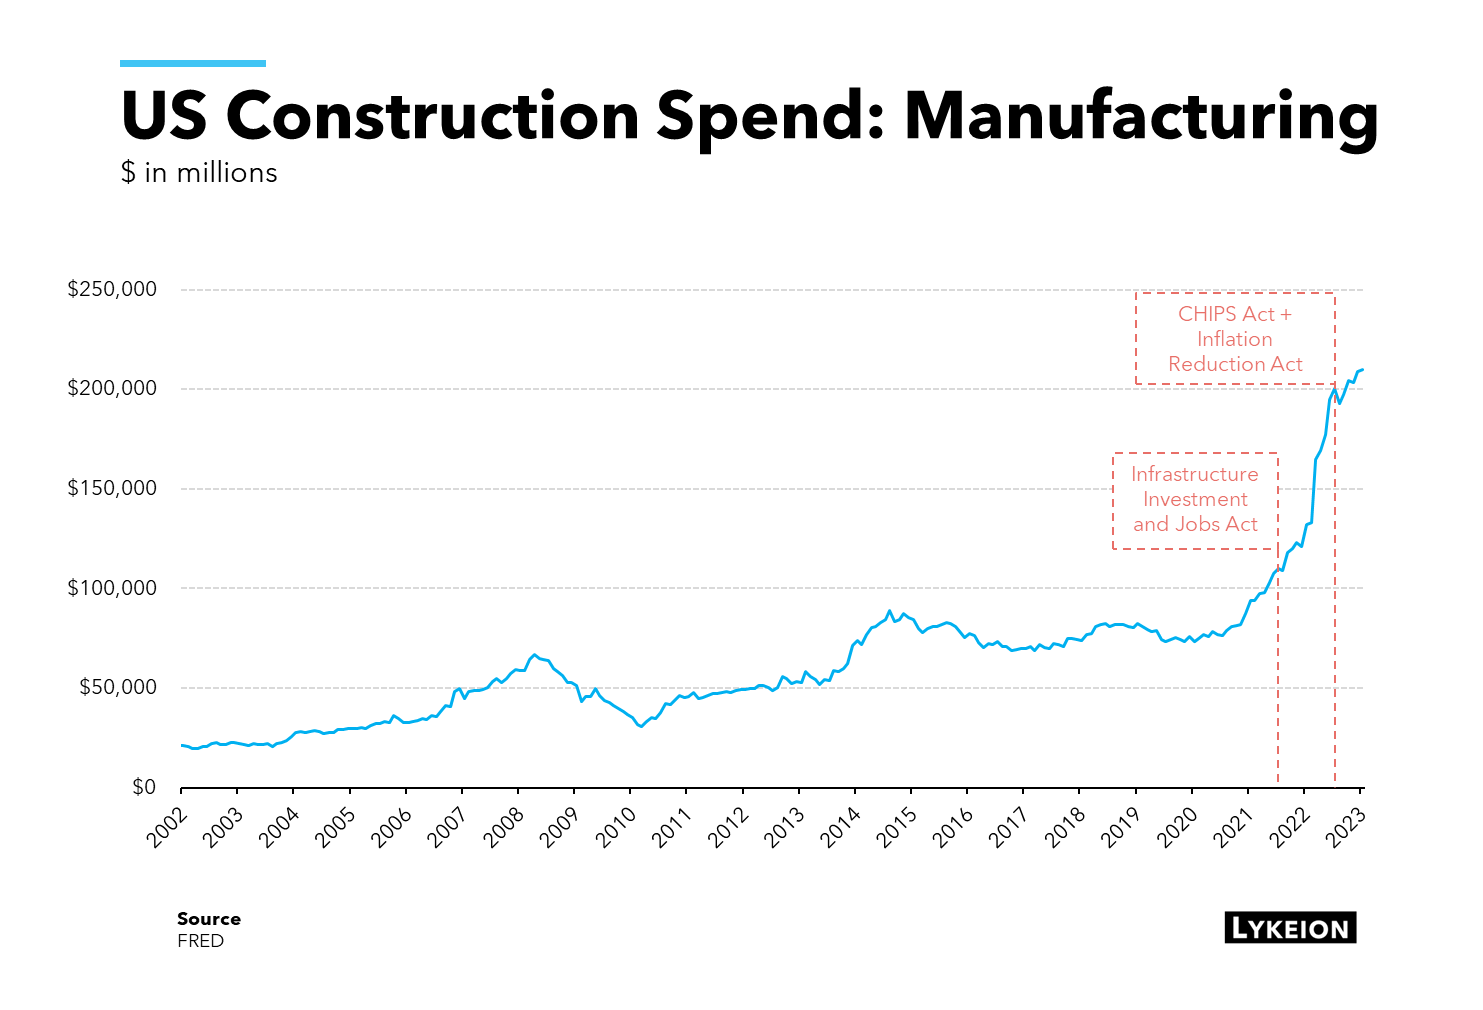
Key to this massive increase in spending are the three large-scale legislative acts signed into law over the last three years: the Infrastructure Investment and Jobs Act (IIJA) (November 2021), the CHIPS and Science Act (August 2022), and the Inflation Reduction Act (August 2022).
Spending had already begun an upward move, breaking away from its longer-term trend in late 2020, but it’s been almost straight up since the passing of the IIJA, which, according to Ernst & Young, will provide $1.2 trillion in federal spending over the next five years across a slew of infrastructure projects, including but not limited to Roads, Bridges, and Major Projects, Power & Grid, Passenger Freight & Rail, Broadband, Water Infrastructure, Airports, and more.
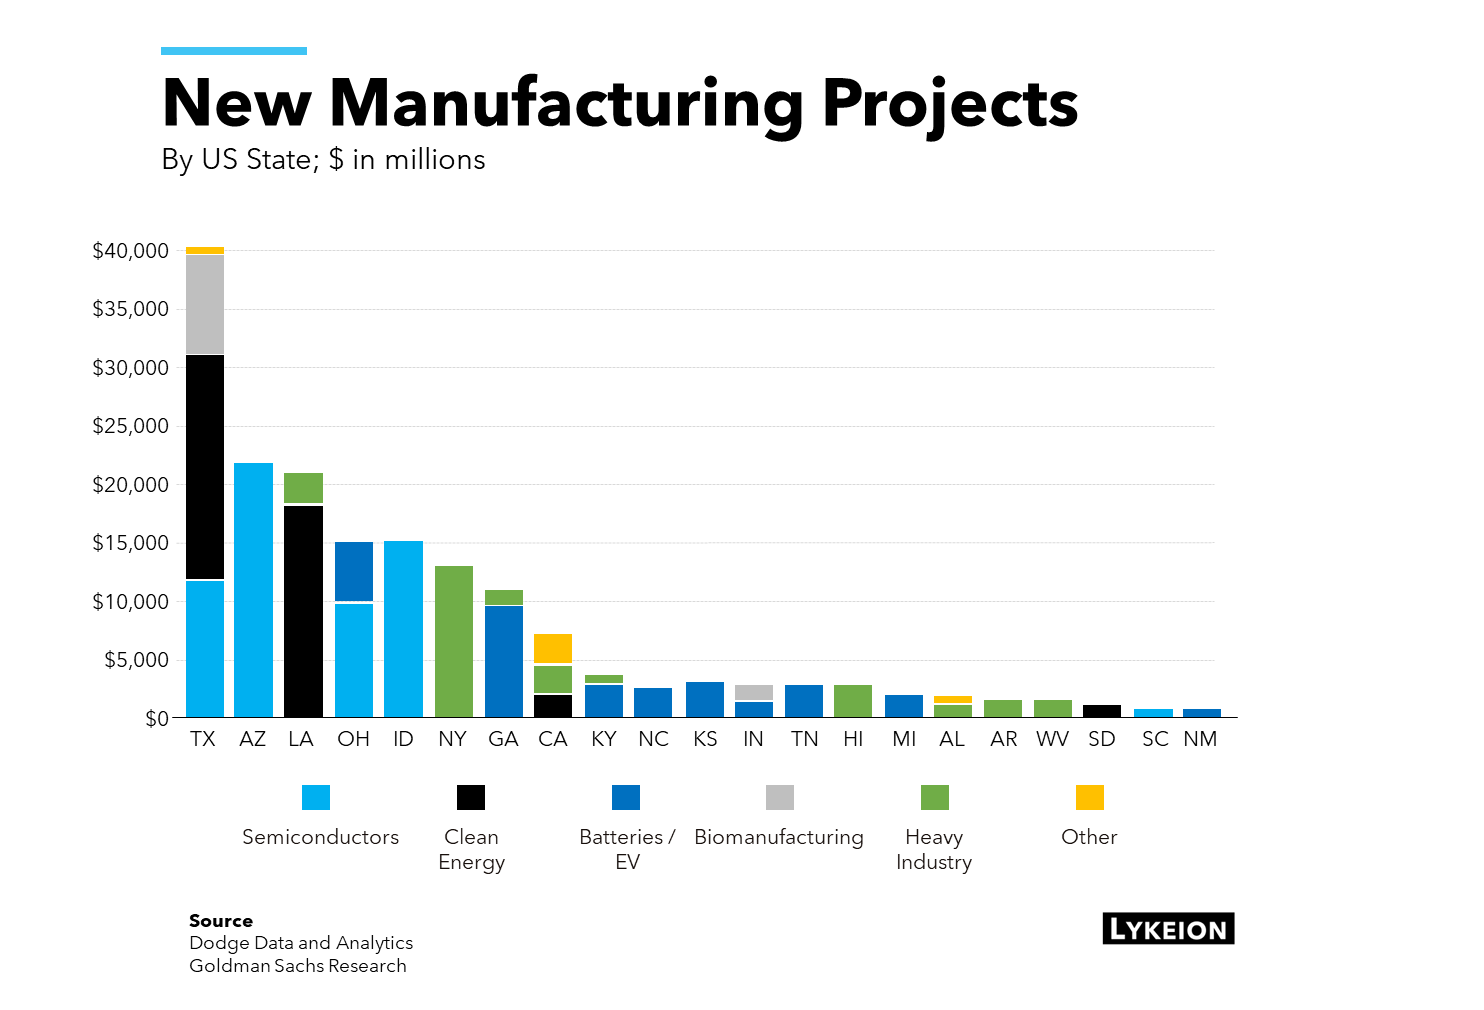
Spending from the IRA and CHIPS Acts are targeted more at semiconductors, batteries, EV infrastructure, and renewables, and combined will inject another ~$1 trillion+ into construction spending.
Here’s a breakdown of which US states are leading the way:
Let’s try to keep our politics aside for a second and just realize that these acts, especially the IIJA, look like they’re actually achieving their stated goals (whether you agree with those goals or not is a different story) – a lot of capital is being deployed and a lot of labor is being utilized, which when combined, helps explain the latest GDP print - a hot 3.3% growth vs the 2% expected by consensus.
Put in context – we’re all aware the US is currently running huge fiscal deficits (by far the largest non-wartime spending by any administration ever), which, if normalized, would have produced a very poor GDP print, exposing the private sector, which actually contracted. (For our non econ folks, remember, GDP = Consumer Spending + Business Investment + Government Spending – Net Exports. So if Government Spending were brought down to long term averages, what’s left is the private sector.)
The takeaway here, in my opinion, is regardless of who steps into office in 2024, a structural increase in fiscal spending has arrived, and it doesn’t look like it’s going away anytime soon. Why?
Because it kills two political birds with one stone – headline GDP growth and national security (or at least the optics of both). What politician wouldn’t maintain this course?
Lastly, if the US is truly committed to deleveraging from China, then the amount of spending to date plus whatever is left over from the big three Acts, is only the tip of iceberg – the amount of capital required to achieve this goal is unimaginable.
Note: we acutely understand that the current course of spending is not sustainable given the current debt load coupled with the spike in interest rates and that even with all the spending, a decoupling from China is a task that is not accomplished in years, but decades. We think that one of the likely consequences of this is sustained higher inflation for longer.
An Update on Maturity Walls
The duality of markets never disappoints.
In November we wrote a deep dive exploring the issue of looming debt maturity walls across governments and corporates (both public and private) that will begin this year, with rates still significantly elevated from where they were just a few years ago.
Here’s an update from S&P Global:
“The proportion of 'CCC/C' ratings to the total is historically large, with many firms already seeing negative cash flow and large maturities due in 2025. This signals a high level of sensitivity to a drop in growth or a further rise in interest rates, which could push the default rate to our pessimistic scenario of 7%.
Defaults are becoming more widespread across sectors, but consumer-facing sectors such as consumer products and media and entertainment, along with health care, are likely to continue leading among defaults as these remain sectors with high leverage and strained cash flow.”
We’re already seeing defaults of Loans and HY Bonds of speculative grade companies beginning to tick up closer to pandemic levels (still far from 2008 however), and we haven’t even really hit the big maturity walls yet – those begin this year (again, a more comprehensive look at this issue is in the maturity walls piece):

Back to Jekyll’s duality: this latest GDP print, while a net positive if you operate in one of the industries that benefit from heavy federal spending (i.e. the construction and manufacturing firms we discussed above but not the media, entertainment, and consumer products firms S&P points out) also makes it more likely that rate cuts, which were widely presumed to begin in Q1 of this year, will be pushed out further.
What’s good news for some can be terrible for others.
For operators of small businesses, which are typically much more sensitive to interest rates for operating and growth capital, this reality is a brutal balancing act. You need rates to come down to finance your business but if rates are coming down it’s likely because the economy is slowing, affecting the growth of your business overall.
The strongest will likely pull through, but companies who have hidden behind cheap money for too long are likely to be exposed in the coming months and years.
The China -> India Pivot
In November Charts, we looked at Foreign Direct Investment flows. In particular, we saw for the first time ever negative flows out of China in Q3 ’23. Now that full year ’23 numbers are in, according to Nikkei Asia, China saw “net outflow of direct investment funds amounted to $118.5 billion, an all-time high for comparable figures dating back to 2010.”
Where’s it all going? That’s for a future deep dive (which we’re working on), but for now, a simpler question to ask is, if not China, then where?
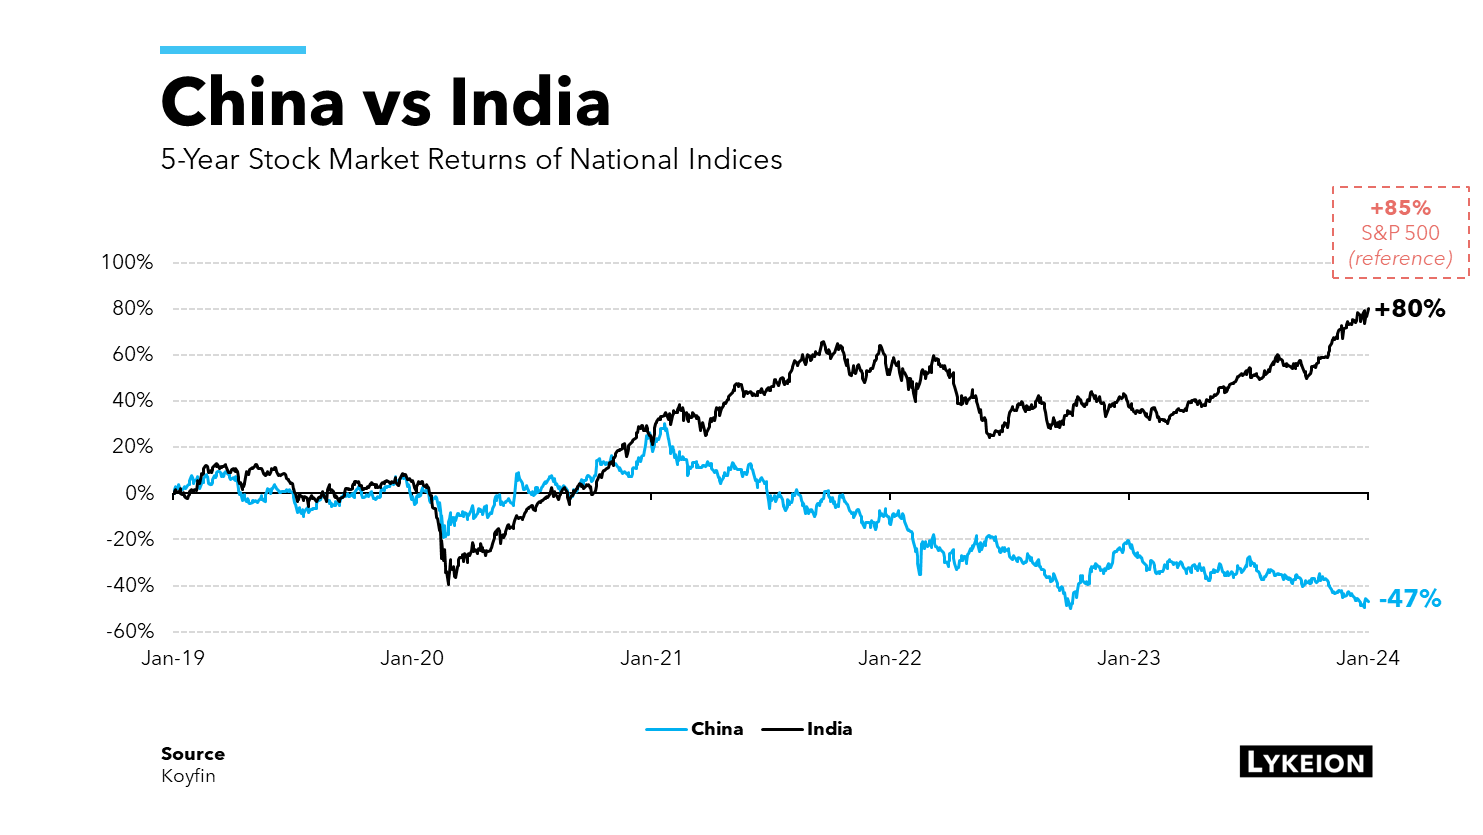
If stock market sentiment is any indicator, the answer may be India.
China’s continuing struggles are well documented (deteriorating economic conditions, demographic headwinds, real estate bubble crashing down) while India’s growth story is just now getting underway.
India is:
Taking no sides in the East vs. West geopolitical battles of today, keeping their options open
Attracting corporate investment that usually flowed into China (Apple and TSMC planting their flags in India will encourage more firms to follow suit)
Arbitraging Russian oil to fill the supply gap back to Europe
Combined with the largest population on the planet with an average age of just 28 years old (relative context given below), and India’s economy is expected to grow north of 6% every year for the next 5 years. Just last week, its finance ministry said it wants to be the third largest economy (overtaking Germany and Japan) by 2030.
The biggest pivot since manufacturing left the West for the East may already be underway.
Indonesia Rising
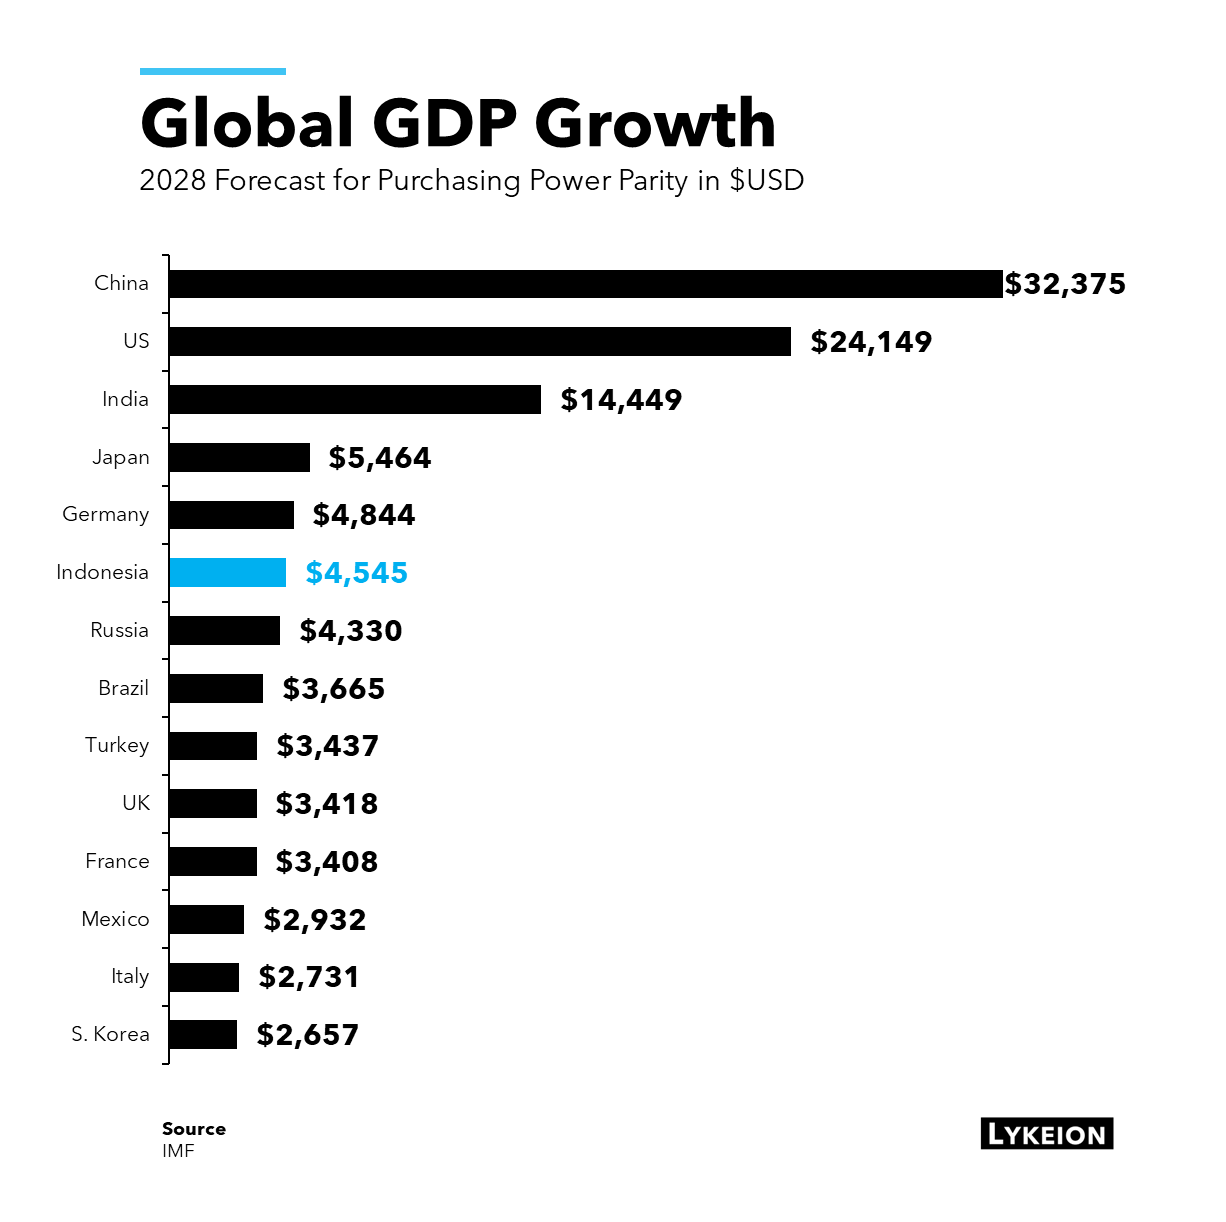
Speaking of economic growth, the IMF recently published its forecast for global GDP growth, and easily the most shocking rise is that of Indonesia.
Often overlooked in the NATO vs. Russia and East vs. West power struggles, Indonesia is a rising power, home to 274 million people (the fourth most populated country in the world), with an average age of 30 years old (vs. the US at 38, China at 39, and Japan at 49!).
Scaled for population size, second only to India in terms of forecasted growth, their economy, measured by Purchasing Power Parity (which is GDP scaled for exchange rate and purchasing power differences across countries), is set to grow to the sixth largest in the world by 2028 – that’s about 5% per year for the next five years.
Of particular interest, and since the world has only recently become aware of the importance of bottlenecked shipping routes (‘Suez Canal’ is a new thing to a lot of people), Indonesia straddles the second busiest shipping route in the world, the Malacca Straight (84,000 transited vessels in 2020 and administered jointly between Indonesia, Malaysia, and Singapore), which is the “primary trade route between Asia and Europe, with goods from China, Japan, South Korea, and other Asian countries passing through to the Middle East and Europe”.
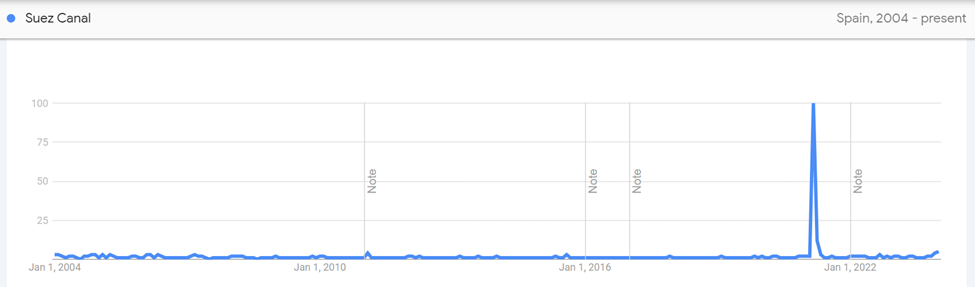
“Google Trends: Suez Canal”

The Malacca Straight Shipping Route
Keep an eye on Indo, and if you happen to be there in April or May, shoot me a line and we’ll grab a Bintang and a paddle out.
💡 Semafor has recently become my go-to newsletter for all things business and finance. They deliver exclusive Wall Street insights and is led by Liz Hoffman, who's covered these stories for decades. She’s one of the best-sourced reporters out there, and many senior executives already swear by her dispatches. Highly recommend you sign up for the twice-weekly newsletter here.